An Introduction to Evals at the Application Layer
To visualize this, we have a basketball court.
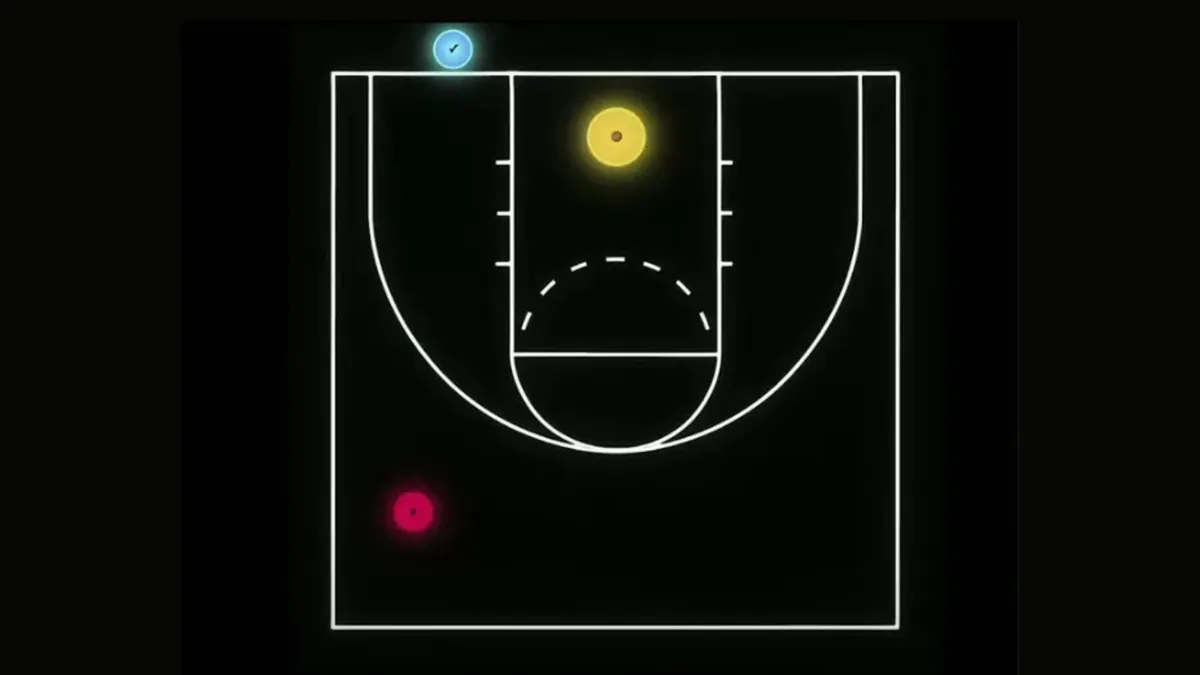
Blue represents shots made, and red represents shots missed.
The first property to consider is that the farther away your shot is from the basket, the harder it is to make.
Another property is that the court has boundaries. So this blue dot—although the shot goes in—is out of the court. So it doesn’t really count in the game.
Let's say you built an app that tells you how many letters are in a given fruit. If you were to ask the app how many Rs are in 'Strawberry', it should say '3'.
In the example above:
- The red dot is pretty far away from the basket so it's a tricky query: How many Rs are in strawberry, pineapple, dragonfruit, mango after we replace all the vowels with Rs? The app was just expecting to be asked about a single fruit, but the question is still technically within the app's domain. In this example, the app got the answer wrong, so we labelled it red, but it sits way outside the 3-point line to signify that it wasn't an easy question.
- The blue dot was a simple question like: How many syllables are in carrot? That’s out of bounds. Our app is meant to count letters, not syllables. It was a simple question (so it's close to the basket) and the app got the answer right (so it's blue), but this is not something we have to test for (so it's out of bounds).
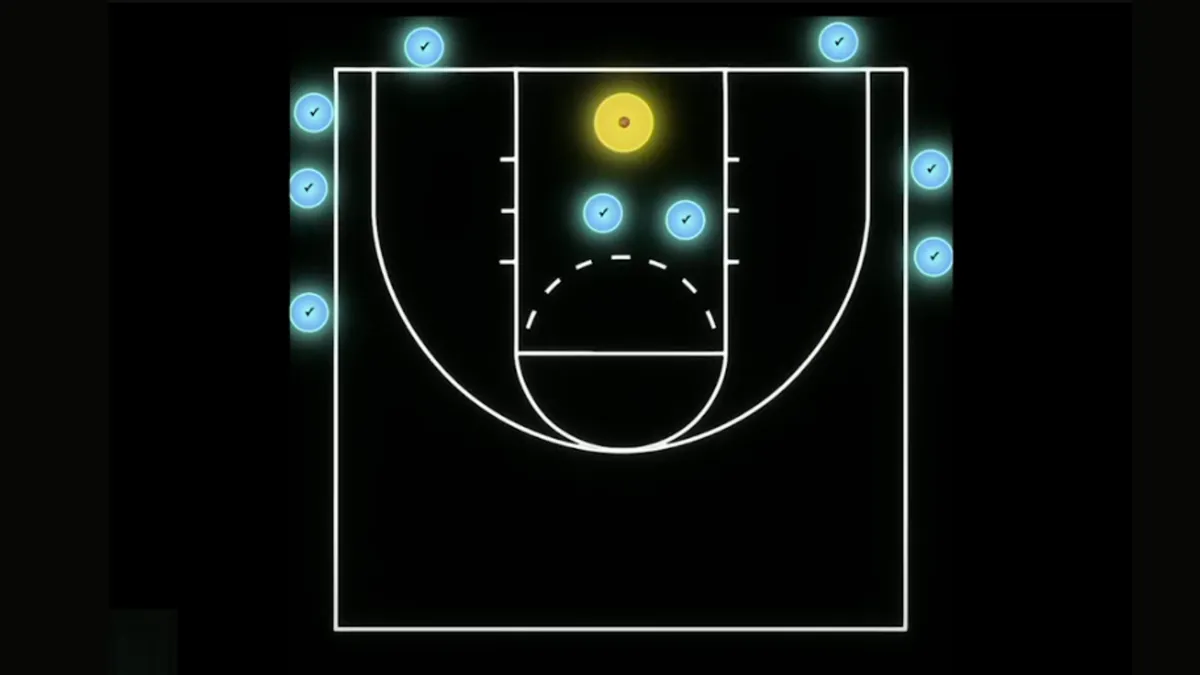
The first trap to watch out for is wasting time on out-of-bounds queries. It's easy to spend feeling productive, making evals for things your users don't care about. You will have enough problems with queries that your users care about.
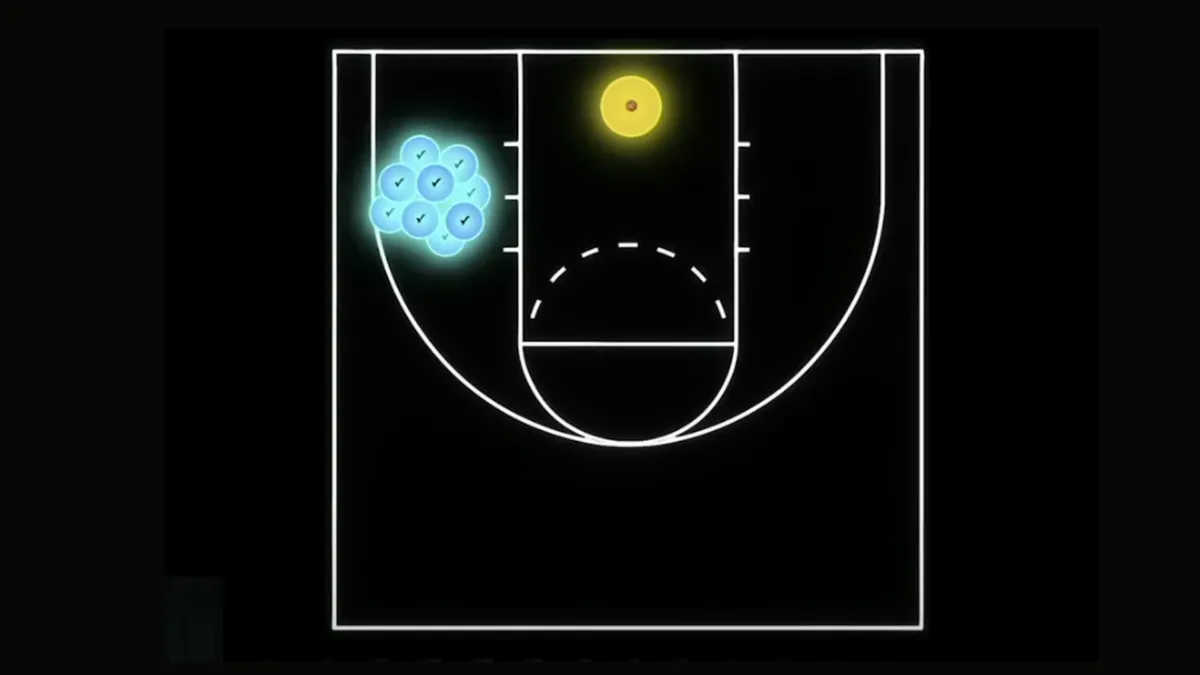
The next trap is to watch out for a concentrated set of queries. When you understand your court, you're going to understand where the boundaries are, and you want to make sure you test across the entire court.
When you’re making evals, the most important step is understanding your "court".
This means collecting as much data as possible:
- Thumbs up/thumbs down feedback. Noisy, but a helpful signal.
- Observability logs: read through random samples once a week.
- Community forums: people reporting issues with the app.
- Twitter/LinkedIn commentary: noisy, but sometimes valuable.
There is no shortcut. You have to do the work to understand what your court looks like.
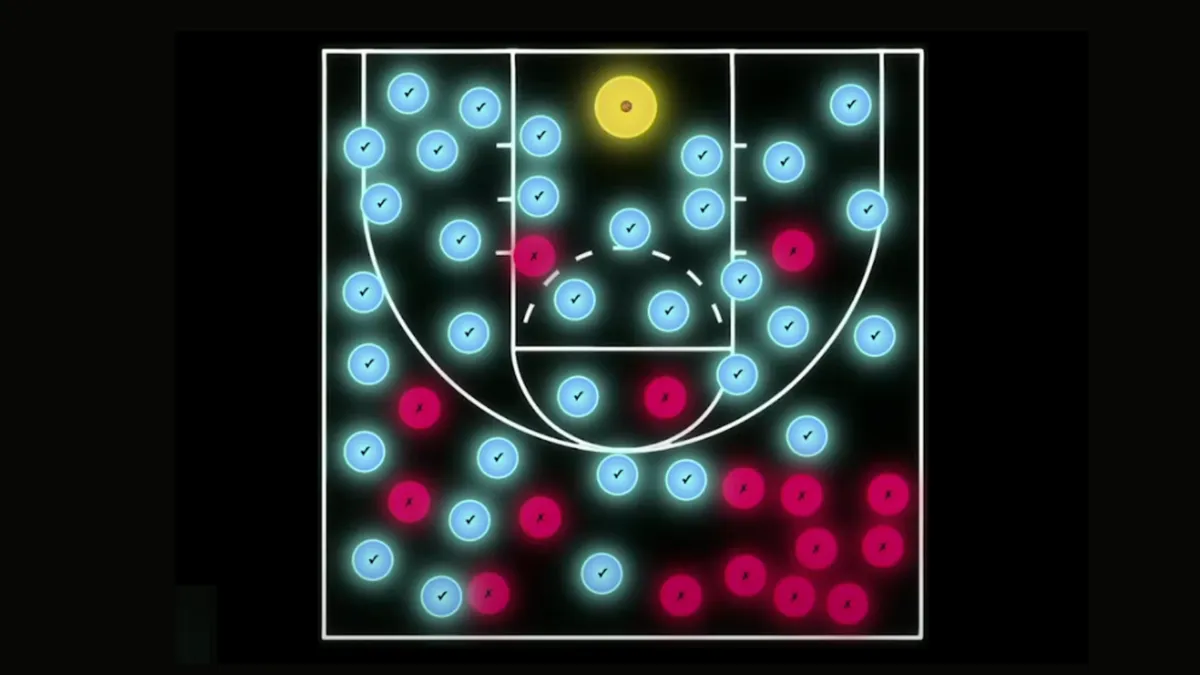
Here is an example of what your court will look like if you are doing a good job of collecting data. You should know where the boundaries are. You should be testing inside your boundaries, and you should understand where your system is blue and the spots where it is red.
With an understanding like this, it's relatively easy to say, "Maybe next week, we need to prioritise teamwork on that bottom right corner. Loads of our users are struggling with these queries, and we can work on doing a good job of flipping those tiles from red to blue."
More importantly, when you do improve things, you can now quantify the improvement. Without a map, improving shots in the top right might lead to a drop in performance at the free-throw line. Mapping things out lets you measure improvements clearly.
Now, every time a model is updated or you make changes to your retrieval mechanism, you can determine if it has led to an improvement and track the change precisely.
All credit to Ido Pesok for this analogy. Thank you for putting such a fantastic talk together.